
Blog
Solar Paired With Storage Hits 16% of New US Capacity
Estimated reading time: 5 minutes · Last updated:
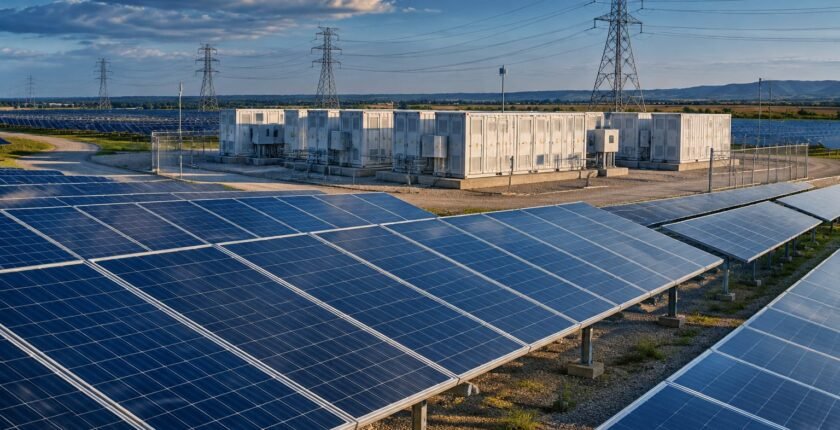
Solar paired with storage is becoming a larger part of what the United States builds. The U.S. Energy Information Administration (EIA), the federal agency that compiles national energy statistics, says more than 16% of the utility-scale solar capacity added in 2026 had operable battery storage on the same site by September. In 2017 that share was 2%. Projects scheduled for the final three months of the year could lift the 2026 figure to 19%, and plans for 2027 and 2028 push it past 30%. EIA traces the shift to wholesale power prices, which sink when solar output is high and recover as it fades. A battery on site lets a plant choose when to sell. Four Southwest states lead the trend.
Key takeaways
- Current share: More than 16% of US utility-scale solar capacity added in 2026 had operable co-located battery storage by September, according to the U.S. Energy Information Administration.
- Long-run climb: The co-located share was 2% in 2017, so it has risen roughly eightfold in nine years on EIA's figures.
- Pipeline: EIA says plans for the last three months of 2026 could raise the year's share to 19%, while plans for 2027 and 2028 put it above 30%.
- Regional lead: California, Arizona, New Mexico and Nevada had co-located shares more than double the national average as of September 2026.
Table of contents
How Far Has Co-Location Climbed Since 2017?
Co-located storage means a battery installed at the same site as a solar array. EIA counts capacity in this category only when the battery is operable, not when it is merely planned. On that basis, more than 16% of the utility-scale solar capacity that came online in 2026 had a working battery beside it by September.
Nine years earlier the figure stood at 2%. That is roughly an eightfold increase between 2017 and the first nine months of 2026. A battery has moved from an unusual addition to a regular feature of new projects.
The year is not over yet. EIA's tally of projects planned for October, November and December suggests the 2026 share could reach 19% if those plants arrive on time. Plans are not completions, so the 19% figure describes what the calendar year might show rather than a result anyone can yet report.
Why Falling Midday Prices Push Developers Toward Batteries
EIA points to the wholesale electricity market as the reason for the shift. Prices there tend to drop when solar supplies a large share of power and climb again as that contribution shrinks.
For a solar plant without storage, this creates an awkward bind. It generates the most electricity during the hours when that electricity fetches the least. Once output tails off and prices recover, it has little left to sell.
A battery on the same site changes the calculation. The operator can route power directly onto the grid when prices are attractive, or divert it into storage when they are weak and sell it later. In plain terms, the plant buys itself the option to wait.
That option is what the rising co-location share reflects. On EIA's explanation, the battery earns its place by shifting the timing of sales, not by adding generation. The value lies in when the electricity reaches the market.
Four Southwest States Run at More Than Twice the National Rate
The pattern is not spread evenly across the country. As of September 2026, California, Arizona, New Mexico and Nevada each had a co-located share more than double the national average, EIA says. The headline figures name the four states but do not give each one a precise percentage, so comparisons between them remain open.
Looking further ahead, plans for 2027 and 2028 put the national share above 30%. If those projects are built as planned, more than three in every ten megawatts of new utility-scale solar would arrive with a battery attached.
That would be a sharp step up from the 16% recorded so far in 2026. It would also bring the national average closer to the levels the four Southwest states have already reached. The rest of the country would then be following a path those states laid down first.
| Period | Co-located share | Status |
|---|---|---|
| 2017 | 2% | Recorded |
| 2026, through September | More than 16% | Operable storage |
| 2026, including fourth-quarter plans | Up to 19% | Planned |
| 2027 | Above 30% | Planned |
| 2028 | Above 30% | Planned |
What could speed up or slow the shift
The case for
- EIA ties the trend to a wholesale price pattern in which solar-heavy hours are cheap and later hours are dearer, which is the gap a co-located battery is built to exploit.
- Plans for 2027 and 2028 already put the co-located share above 30%, roughly double the share recorded so far in 2026.
The case against
- The 19% and above-30% figures rest on planned projects, and planned capacity is not the same as operable capacity.
- The trend is concentrated in California, Arizona, New Mexico and Nevada, so the national figure depends heavily on what gets built in four states.
What to be careful about
- Planned projects for late 2026, 2027 and 2028 may not reach operation on schedule, which would leave the realised share below EIA's planned figures.
- The economic case EIA describes depends on wholesale prices continuing to swing with solar output; a narrower swing would weaken the reason to add a battery.
- State-level percentages are not given in the headline data, so the size of the Southwest lead beyond 'more than double' cannot be measured from these figures.
The bottom line
The direction is clear even if the final numbers are not. EIA's data show batteries moving from 2% of new utility-scale solar capacity in 2017 to more than 16% by September 2026, with plans pointing past 30% by 2028. The reason is economic, not ideological: when solar pushes midday prices down, the ability to hold power back and sell it later is worth paying for. Two caveats apply. Much of the forward figure rests on plans rather than operating plants, and the lead is concentrated in four Southwest states. Whether the rest of the country catches up will show in how many of the 2027 and 2028 projects actually switch on.
What to watch
- Watch whether projects planned for the rest of 2026 come online in time to lift the year's co-located share toward 19%; EIA has not set a date for full-year figures.
- Track the 2027 build pipeline to see whether the planned co-located share above 30% holds as projects move from plans to operation.
- Look for state-level updates on California, Arizona, New Mexico and Nevada through 2027 and 2028 to see whether the gap with the national average narrows; no publication date has been given.
Frequently asked questions
What does co-located battery storage mean for a solar farm?
It means the battery sits at the same site as the solar panels. The U.S. Energy Information Administration counts it only when the battery is operable, and on that basis more than 16% of new 2026 utility-scale solar qualified by September.
Why are more US solar plants adding batteries?
EIA links it to wholesale prices, which fall when solar output is high and rise as it drops. A battery lets the operator hold power back from the cheap hours and sell it once prices have recovered.
Which states have the most solar paired with storage?
California, Arizona, New Mexico and Nevada lead, each with a co-located share more than double the national average as of September 2026, according to EIA.
How much new US solar will come with batteries by 2028?
EIA says plans for 2027 and 2028 put the share above 30%. Those are planned projects, so the final figure depends on how many are actually built.
Related reading