
Blog
Battery storage on 37% of new U.S. residential solar in 2025
Estimated reading time: 4 minutes · Last updated:
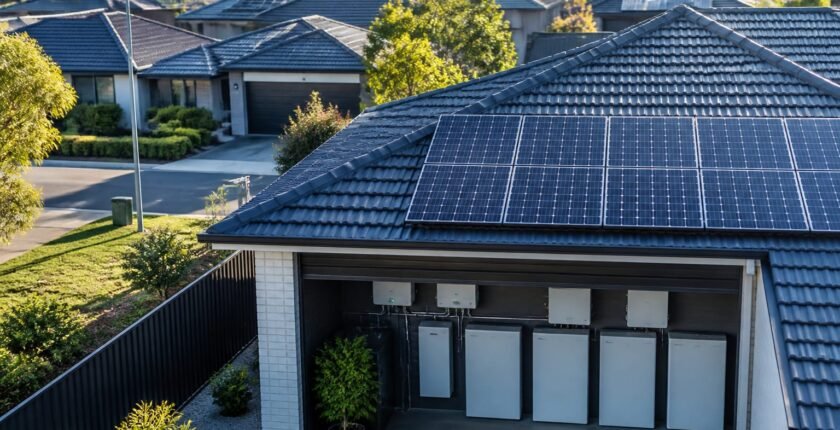
Battery storage was paired with 37% of new U.S. residential solar installations in 2025, up from 25% in 2024, Lawrence Berkeley National Laboratory reports. The lab’s annual U.S. Distributed Solar and Storage Data update covers roughly 5.3 million distributed systems installed through the end of 2025 and counts about 450,000 systems added during 2025, an amount the lab estimates represents 93% of that year’s U.S. distributed solar market. The shift reflects both a near-universal uptake in California and faster growth outside the state as changes in export compensation and time-of-use rates raise the value of storing daytime generation.
Key takeaways
- National attachment rate: Battery storage was attached to 37% of new U.S. residential solar systems in 2025, up from 25% in 2024, per Lawrence Berkeley National Laboratory.
- Dataset scope: Berkeley Lab’s dataset covers roughly 5.3 million distributed solar and solar-plus-storage systems through the end of 2025, including about 450,000 installs in 2025 (an estimated 93% of the market).
- California vs rest of US: California saw a 74% residential storage attachment rate in 2025 (58% in 2024), while the rate outside California rose from 7% to 17% year-over-year.
- System specs: Median residential storage capacity remained 13.5 kWh in both 2024 and 2025, while typical discharge capability rose from 6 kW to 11.4 kW.
Table of contents
How Berkeley Lab measures attachment and what the numbers mean
Lawrence Berkeley National Laboratory’s U.S. Distributed Solar and Storage Data update counts how often installers add batteries to new solar projects; it excludes batteries installed later and standalone systems. Using that narrower measure, the lab reports a rise in the residential storage attachment rate to 37% in 2025 from 25% in 2024. The underlying dataset includes roughly 5.3 million distributed solar and solar-plus-storage systems installed through the end of 2025 and about 450,000 installations recorded in 2025, which the lab says captures an estimated 93% of the U.S. distributed solar market for the year.
Because the figure tracks batteries paired at the time of solar install, it directly reflects installer behaviour and sales packaging rather than total household battery deployment. That caveat matters when comparing attachment rates with broader measures of residential storage adoption that include retrofit and standalone batteries.
Why California led the change and why other states caught up
California accounted for much of the national increase: 74% of new residential solar systems in the state included storage in 2025, up from 58% in 2024. The state’s shift to a Net Billing Tariff, commonly called NEM 3.0, in April 2023 reduced the value of exported solar for many hours and made storing excess generation more economically attractive to new rooftop solar customers.
Outside California the residential attachment rate rose sharply from 7% to 17% in one year. Berkeley Lab does not ascribe that jump to a single cause, but installers in multiple states are responding to similar commercial signals — weaker export compensation, growing deployment of time-of-use and demand charges, and customer interest in resilience — all of which raise the economics of pairing batteries with new arrays. The dataset highlights large increases in Arizona and Texas and continued high rates in Hawaii.
What’s changing on systems themselves and the limits of the data
While the median amount of stored energy per residential battery held at 13.5 kWh in both 2024 and 2025, the typical power those batteries can deliver rose sharply. Berkeley Lab reports median discharge capability moved from 6 kW in 2024 to 11.4 kW in 2025, a change the lab links in part to higher-discharge models such as Tesla’s Powerwall 3. That trend shifts what batteries can do for homes, enabling larger on-demand loads and faster backup performance.
The lab also notes that non-residential attachment rates remain much lower: batteries accompanied 11% of U.S. non-residential solar installs in 2025, up from 7% in 2024. And, because the dataset omits batteries added after initial solar install and standalone deployments, it understates total residential battery capacity growth measured across all installation types.
| Metric | 2024 | 2025 | Source note |
|---|---|---|---|
| Residential storage attachment rate (U.S.) | 25% | 37% | Berkeley Lab — new solar installs only |
| California residential attachment rate | 58% | 74% | Berkeley Lab |
| Residential median storage capacity | 13.5 kWh | 13.5 kWh | Berkeley Lab |
| Residential median discharge capability | 6 kW | 11.4 kW | Berkeley Lab |
Arguments for and against continued rapid uptake
The case for
- Rate reforms and lower export compensation in more states will keep improving the case for pairing batteries with new solar.
- Higher-discharge products such as Tesla Powerwall 3 make storage more useful for resilience and peak shaving, broadening buyer appeal.
The case against
- Attachment growth will slow if state regulators restore stronger export compensation or if wholesale and retail rate designs fail to reward stored consumption.
- Supply chain or module shortages, or rising battery prices, could push installers to decouple storage from new solar offers.
What to be careful about
- The attachment-rate metric excludes batteries installed after the initial solar installation, so it understates total residential battery deployment.
- Regulatory reversals on export compensation or time-of-use design could reduce financial incentives that have driven recent uptake.
- Rising retail electricity rates or changes to incentive structures could shift the balance of economics among customer segments, altering uptake patterns.
The bottom line
The Lawrence Berkeley National Laboratory data show solar-plus-storage moving from niche to mainstream in the new-install market: installers attached batteries to more than one in three new residential solar systems in 2025. California remains the single largest driver, but the doubling of attachment rates outside the state signals a broader market transition driven by rate design and consumer demand for resilience. Because the dataset measures pairing at time of install, it understates retrofit and standalone battery deployments; nonetheless, the rise in system discharge capability suggests the market is not just adding capacity but is changing what batteries can deliver to customers.
What to watch
- Watch for Lawrence Berkeley National Laboratory’s next U.S. Distributed Solar and Storage Data update; no publication date has been set.
- Watch for state utility commission rulemakings or tariff filings that alter export compensation or time-of-use rates in major rooftop markets; no specific dates have been set.
Frequently asked questions
How common was battery pairing with new residential solar in 2025?
Berkeley Lab reports batteries were paired with 37% of new U.S. residential solar installations in 2025, up from 25% in 2024.
Did California drive the national increase in storage adoption?
California led the change: 74% of new residential solar installs in the state included storage in 2025 versus 58% in 2024, while the rate outside California rose from 7% to 17%.
Are batteries getting larger or more powerful?
Median stored energy per residential battery stayed at 13.5 kWh in both years, but median discharge capability rose from 6 kW in 2024 to 11.4 kW in 2025, a shift Berkeley Lab links partly to higher-discharge models such as Tesla Powerwall 3.
Related reading